I’ve always been fascinated by GPS data visualization, particularly in fitness tracking. While standard 2D maps are useful, they don’t tell the whole story - especially when it comes to elevation changes. That’s what led me to experiment with MapBox’s 3D capabilities and the Fitbit API.
The Concept
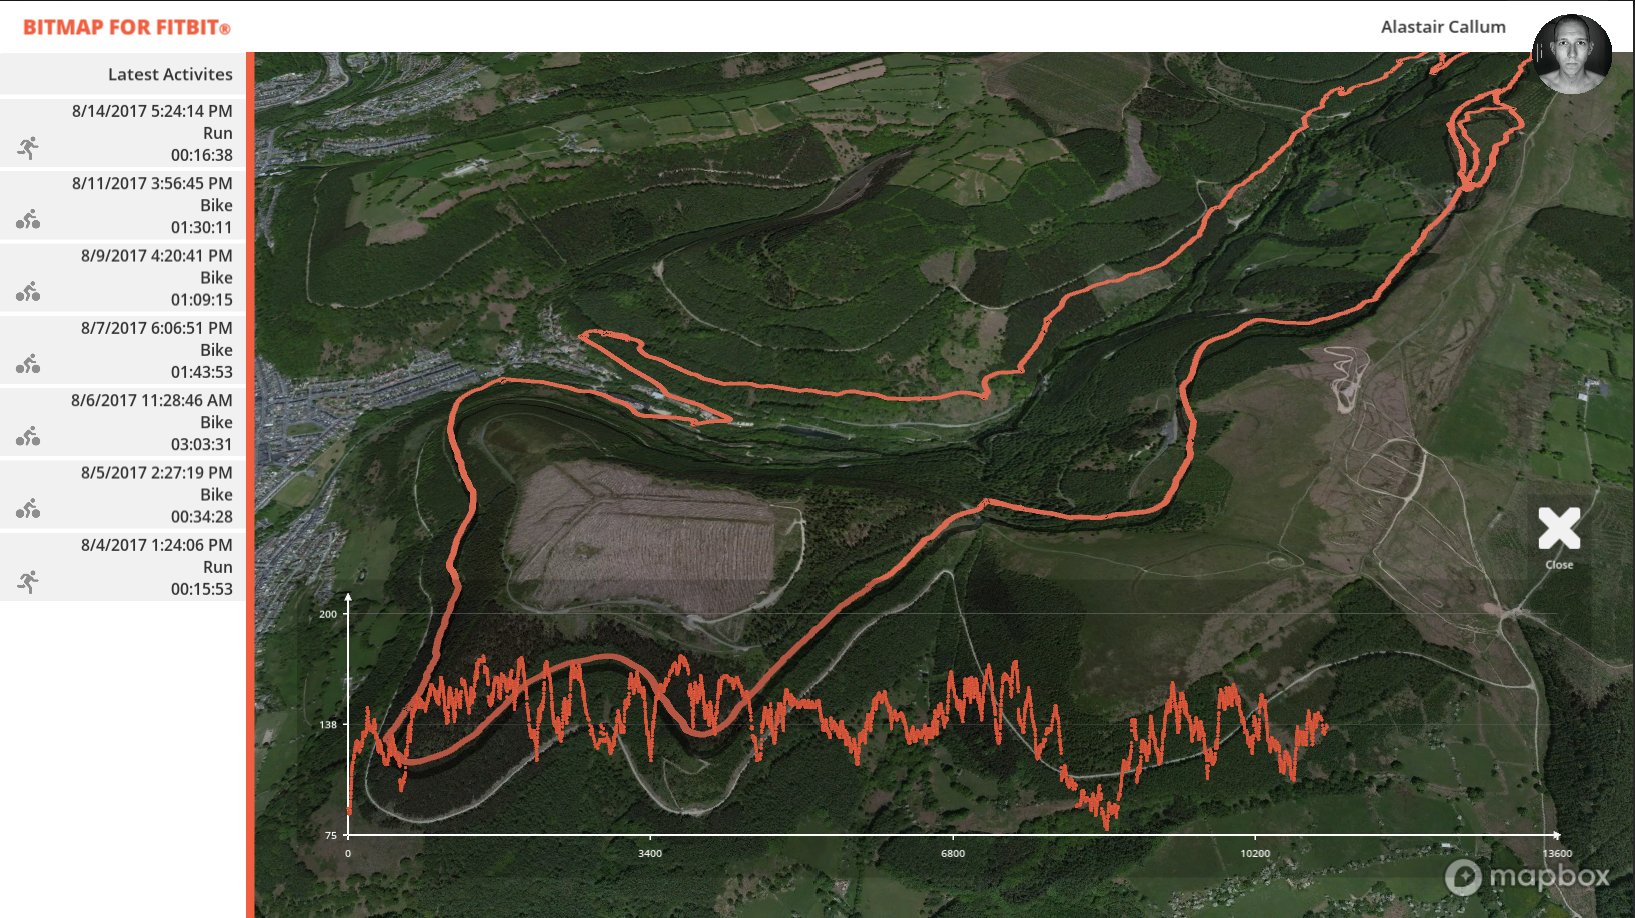
BitMap Prototype Interface
The idea was simple: take GPX data from Fitbit activities and render it in an interactive 3D environment. MapBox’s GL JS library provided the perfect foundation for this, allowing for terrain visualization and custom data overlays.
Technical Implementation
The prototype consists of three main components:
- Fitbit API integration for fetching activity data
- Data processing to convert GPX to GeoJSON
- 3D visualization using MapBox GL JS
// Example of processing GPX data for MapBox
const processGPXData = (gpxData) => {
  return {
    type: 'Feature',
    properties: {
      elevation: gpxData.elevation,
      timestamp: gpxData.timestamp
    },
    geometry: {
      type: 'LineString',
      coordinates: gpxData.points
    }
  };
};
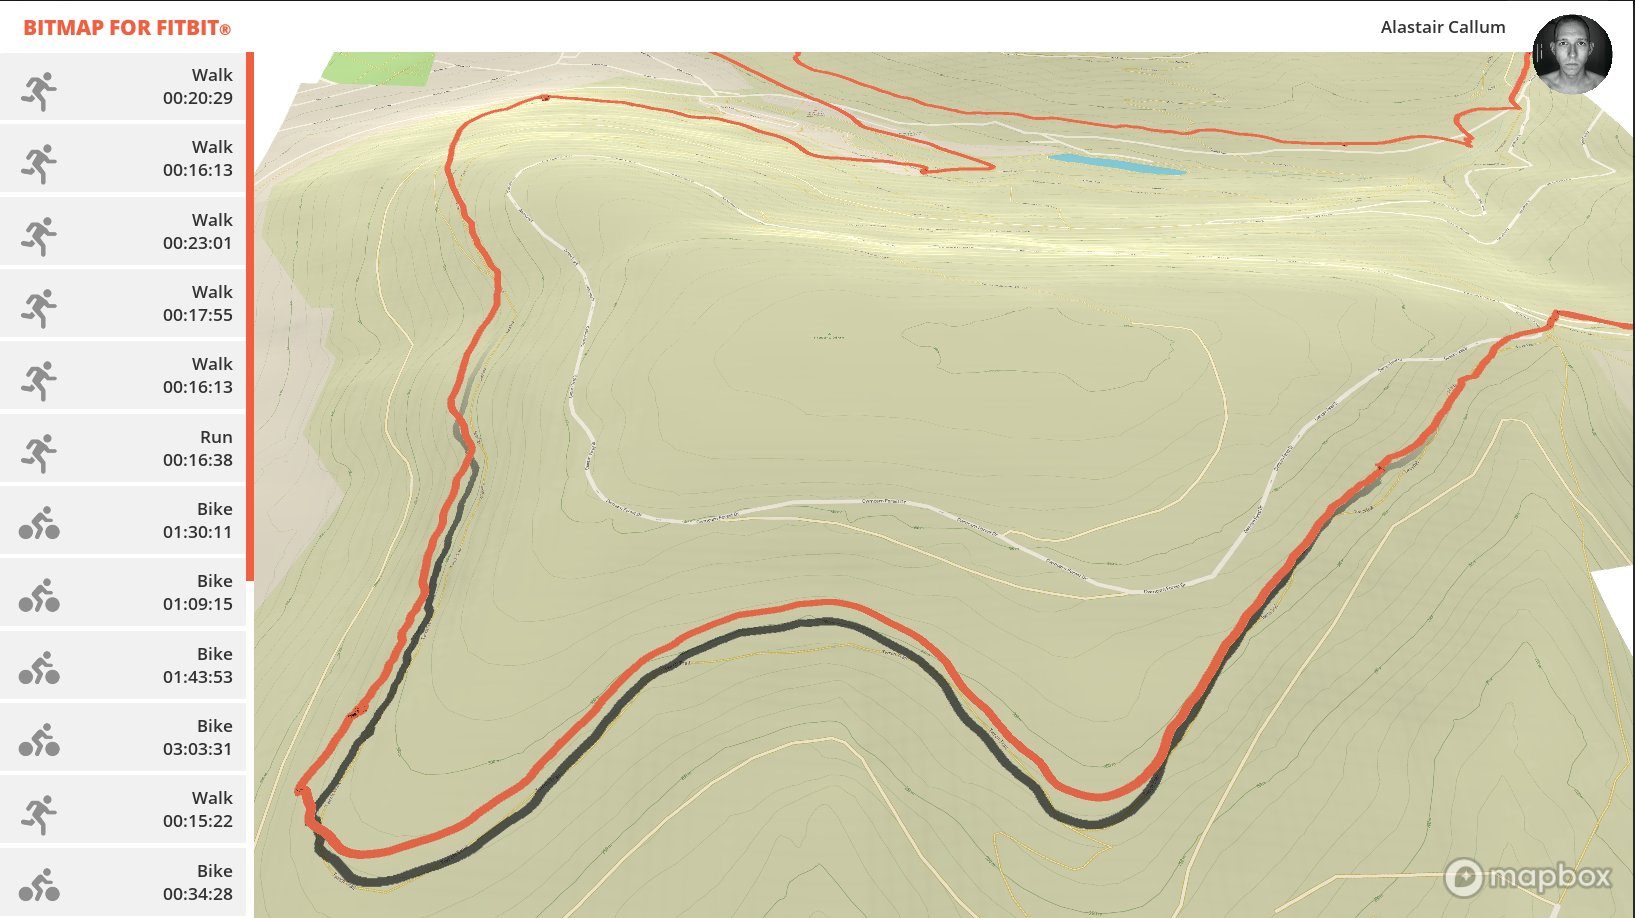
3D Elevation View
Challenges
The biggest challenge was handling elevation data effectively. MapBox’s terrain data didn’t always match the GPS elevation readings from Fitbit, leading to some interesting visual discrepancies. I ended up implementing a hybrid approach, using Fitbit’s elevation data for the activity line and MapBox’s terrain data for the surrounding landscape.
What I Learned
- MapBox GL JS is incredibly powerful but has a steep learning curve
- Fitbit’s API is well-documented but rate limits can be tricky
- GPS data often needs cleanup before visualization
- 3D rendering performance requires careful optimization
Next Steps
While this is just a prototype, there’s potential for something more. The ability to visualize fitness data in 3D adds a new dimension to activity tracking (pun intended). I’m particularly interested in adding support for comparing multiple activities and incorporating more metrics from Fitbit’s API.
For now, though, it’s a fun experiment in combining fitness tracking with 3D visualization. If you’re interested in the technical details, feel free to reach out - I’m always happy to chat about GPS data visualization.